Growing up made easier
This page may not generalize to all family consumptions or geographic areas, nor does the analysis presented consider all possible items or stores.
In a previous article, I searched grocery stores for various items to figure out, on average, which of the stores at which we shop was the cheapest. In the time Since that article, friends and family alike have suggested a similar exercise for other stores, so like a true penny-pincher, I spent 7 hours on a Saturday tracking down prices (with only a few dirty looks from employees). This time, I selected 45 common items and 5 stores. Once again, where possible, I tried to find comparable items across the stores (which was still harder than I thought), and I'd usually pick the cheapest version of an item if there were multiple choices. This is an important qualification of this analysis: the prices here aren't necessarily for the highest quality item.
Using R, I normalized the data to calculate a price per unit. I then calculated the price per item per month (since if I only have to buy an expensive item once per year at a store but everything else is cheap, I'll still want to go there). This is the second important qualification of this analysis: I had to estimate how many times per month we bought each item. I guarantee that no one else has the same grocery purchase profile as the one I used.
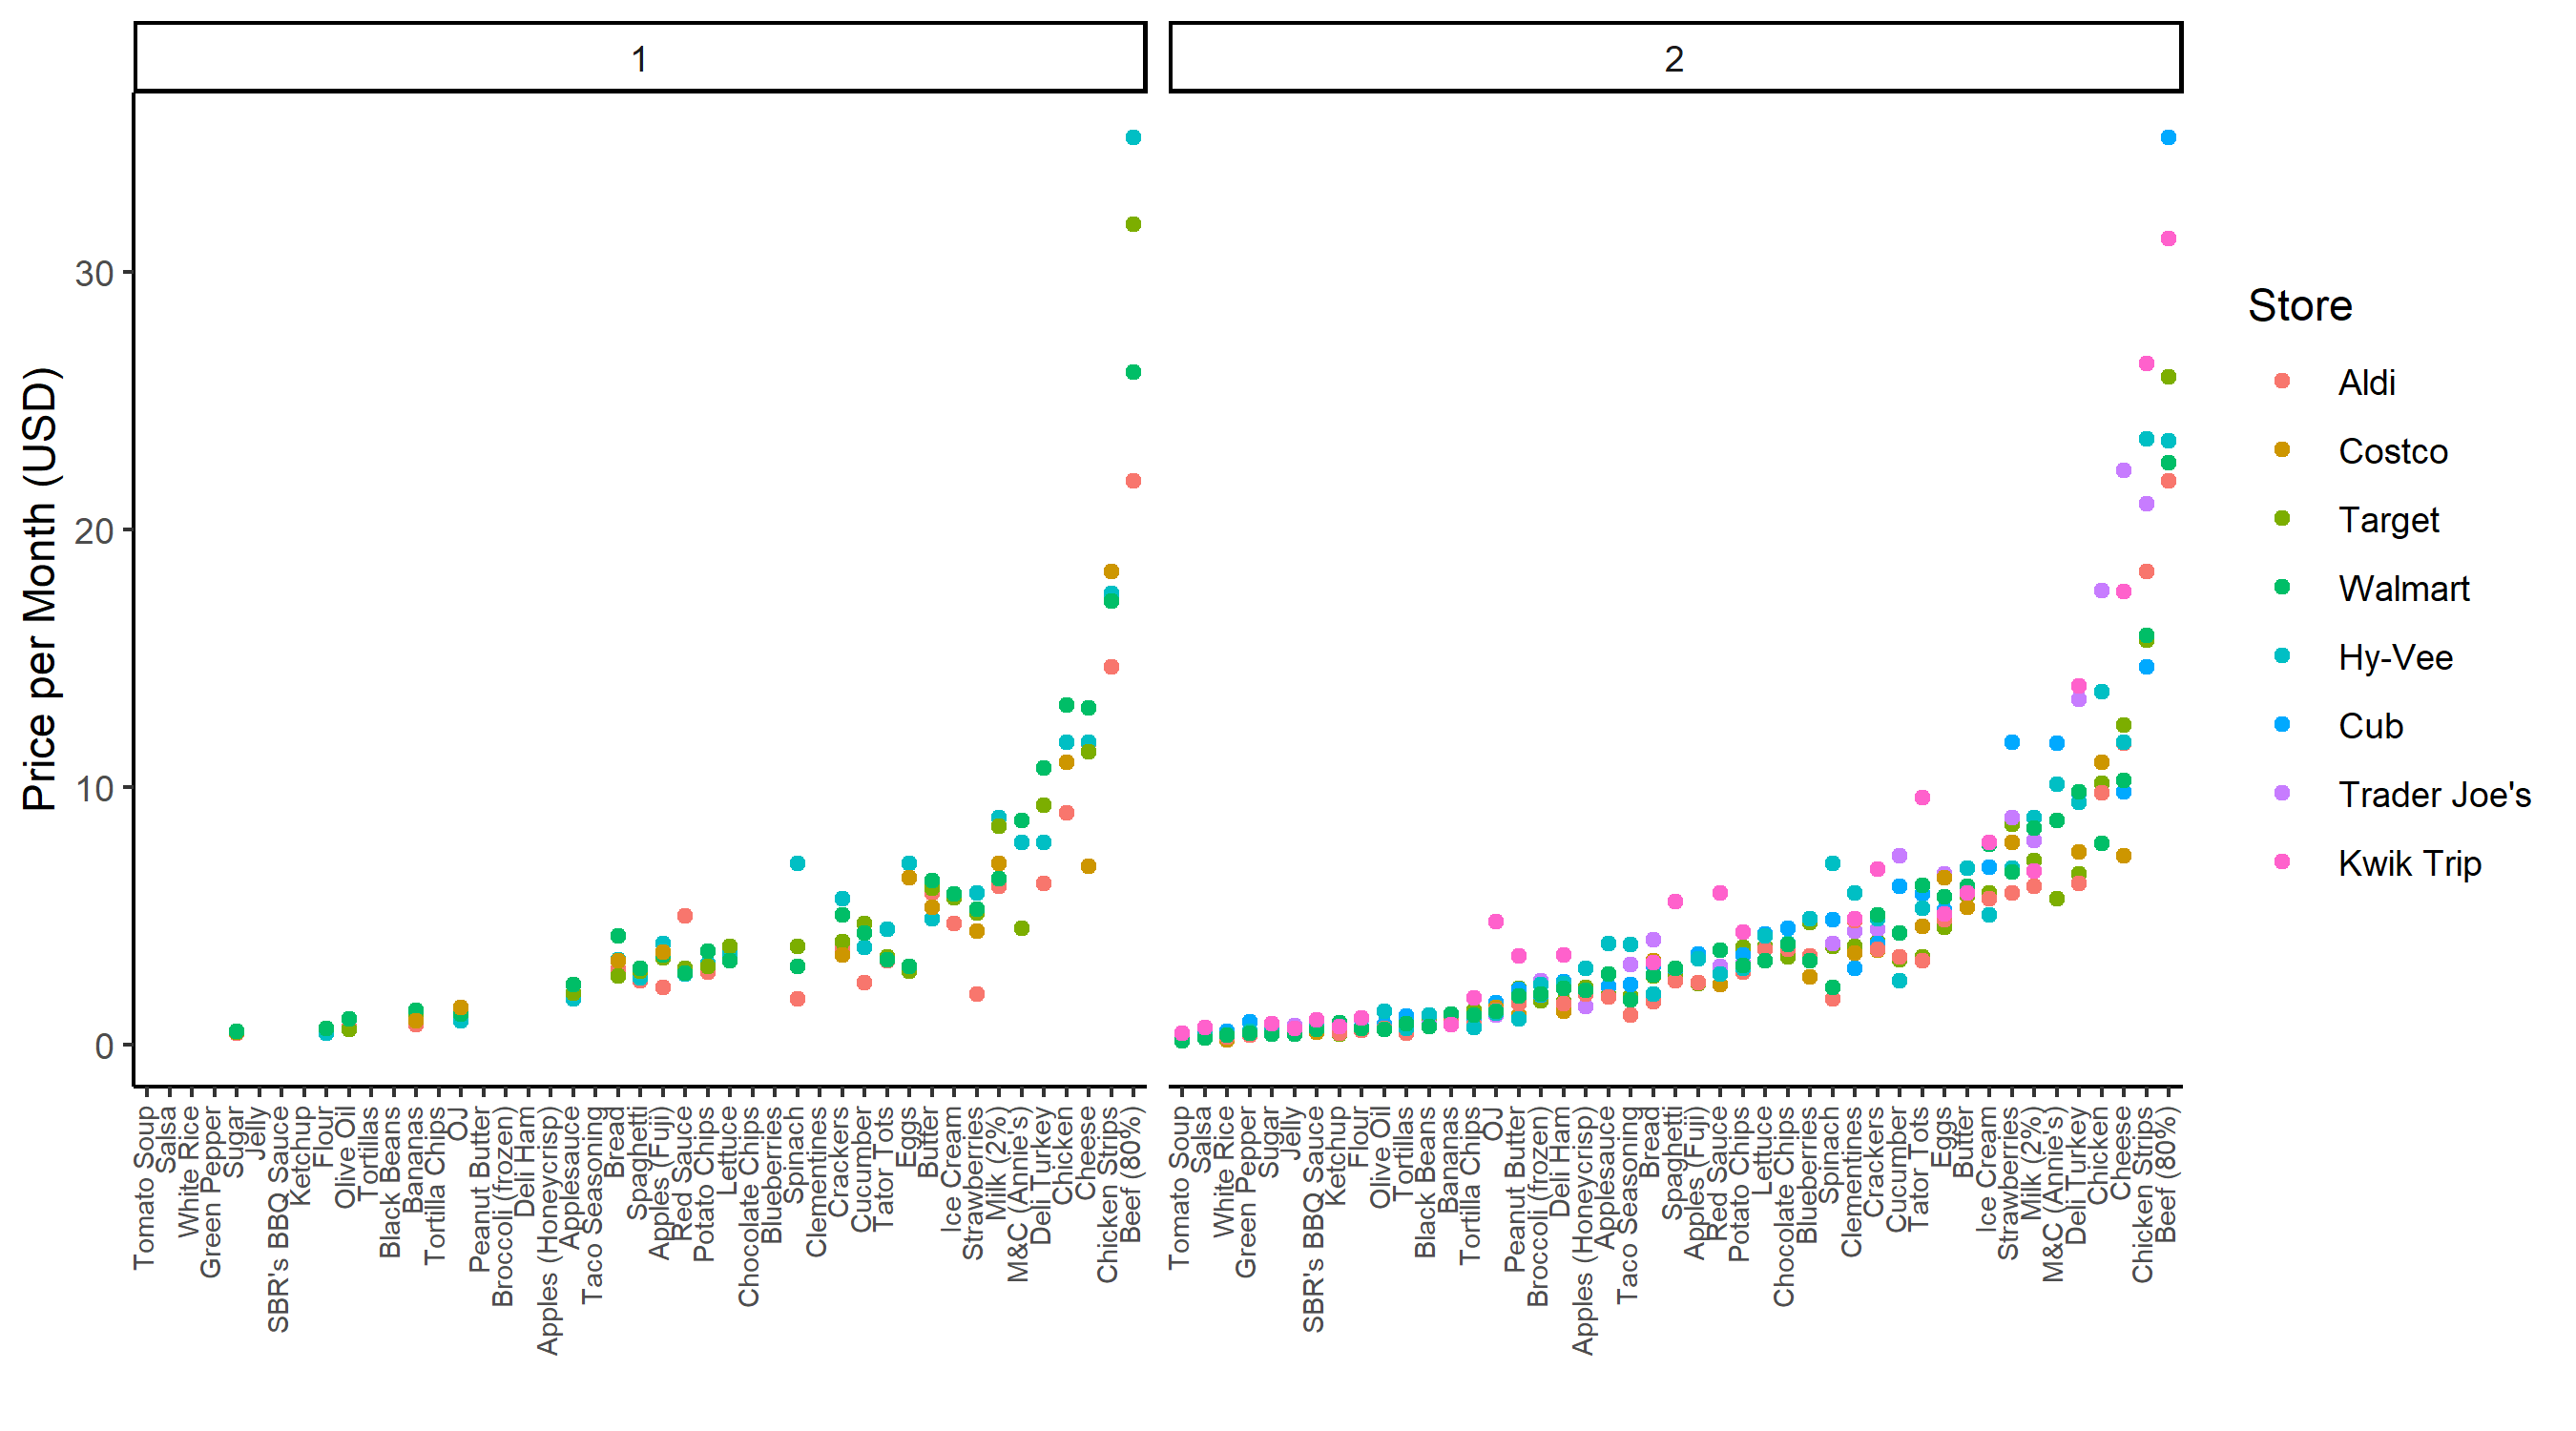
The results shook out like this (visit #1 on the left, #2 on the right):

I ran a linear mixed effects model to predict the (natural log of) price per month per item, using Item and Seasonality (of certain produce) as random effects and Store as a fixed effect. The full results are here, but I'll summarize them briefly below:
Once again, Target is helped by the fact that I have the Target app and a RedCard, which means all items are essentially already 5% off for me. At all the other stores, I took into account my 2% cash back on my normal credit card.
To make sure these results weren't driven by a single item, I ran a sensitivity analysis, removing each item in turn and recalculating the model. Cub traded spots with Trader Joe's in 5/45 models, but all other stores remained firm in their rankings.
So what did we learn?